Motivation behind this
I have done few proof-of-concepts on Big Objects which has limitations of showing records in Salesforce Standard reports and dashboards. Big Objects can hold millions and billions of records which are good for data archival purpose. To display data in reports data must exist in Salesforce objects (Standard, Custom or External) where as for Big Objects, Standard reporting is not supported.
Today, I was going through the trailhead module Integrate Local and Remote Data in Einstein Analytics and thought of displaying Big Objects data using Einstein Analytics Studio and to overcome this limitation in a different ways.
Today, I was going through the trailhead module Integrate Local and Remote Data in Einstein Analytics and thought of displaying Big Objects data using Einstein Analytics Studio and to overcome this limitation in a different ways.
Little bit information about Big Objects
- It stores billions of data on Salesforce Platform and we can archive data from other objects or datasets.
- There are two type of Big Objects: Standard and Custom
- Only following field types are available: Lookup Relation, Number, Text, Long Text Area and Date/Time
- Big Object supports custom Lightning and Visualforce components rather than standard UI elements home pages, detail pages, list views etc.
- We can create up to 100 Big Objects in per org.
- It doesn't support encryption.
For more information, refer Big Objects Implementation Guide
Use Case
Business has a requirement to show Big Objects data as reports and dashboards so that archived data can be viewed without loading them in Salesforce objects again.
Though developers can build custom UI screen using Lightning or Visualforce but Business wants them as reports/dashboards so that even Salesforce Administrator can maintain those.
Expected Outcome
After creating dashboard using Einstein Analytics Studio, it will look like this, though there are various types of charts are supported.

Solution Approach
First, create Big Object called Application (API name: Application__b) as follows:

Account acct = [SELECT Id, Name FROM Account WHERE Id='0012v00002RuJp7AAF'];

Application__b appObj = new Application__b();
appObj.Name__c = 'My Application';
appObj.Amount__c = 100;
appObj.Description__c = 'Testing with data';
appObj.Account__c = acct.Id;
appObj.StartDate__c = System.today();

Database.insertImmediate(appObj);
For archival purpose, if data needs to be inserted then it can be done through batch processing.
Some terminology of Einstein Analytics
An Einstein Analytics app - is a curated set of analyses and paths through your data, plus powerful tools for spontaneous, deep explorations. Analytics starts with apps. Apps organize data projects, run presentations directly from dashboards, and control asset sharing.
A lens - is a visualization of data in a dataset. You use the lens to explore data graphically and to build queries for a dashboard.
Configuring Einstein Analytics Studio
If we follow step by step the above trailhead project, it will be very easy.
Sign Up for an Analytics Developer Edition Org
For actual development, Customer has to procure the licenses.
Create a Dataflow
Navigation: Analytics Studio -> Data Manager -> Dataflows & Recipes
I have create a dataflow named Big Object Dataflow.
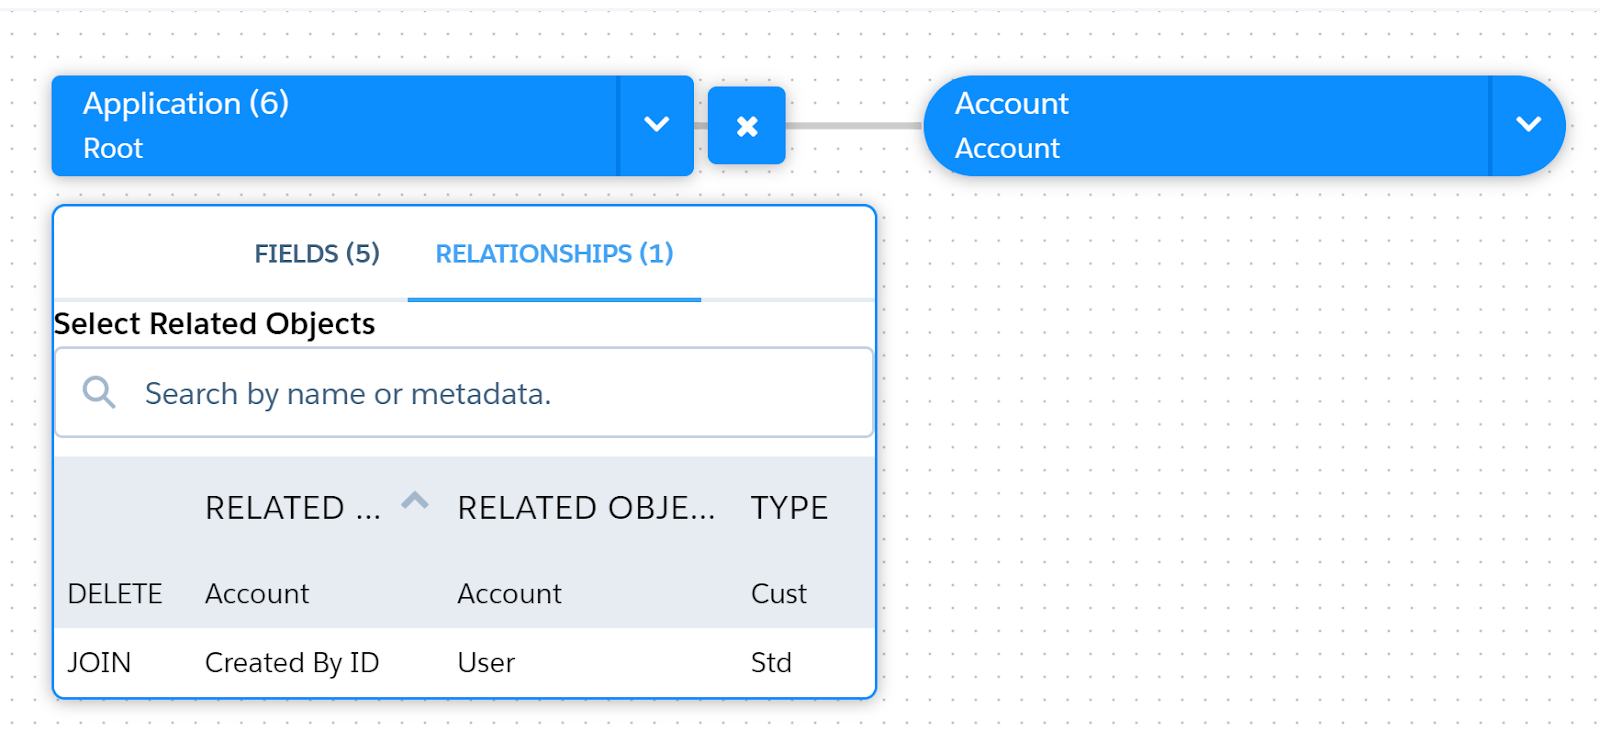
Here Application object is the root object and Account is related object. You can also see that, Application object has a lookup relationship to Account.
Create a Dataset

Choose root object and fields
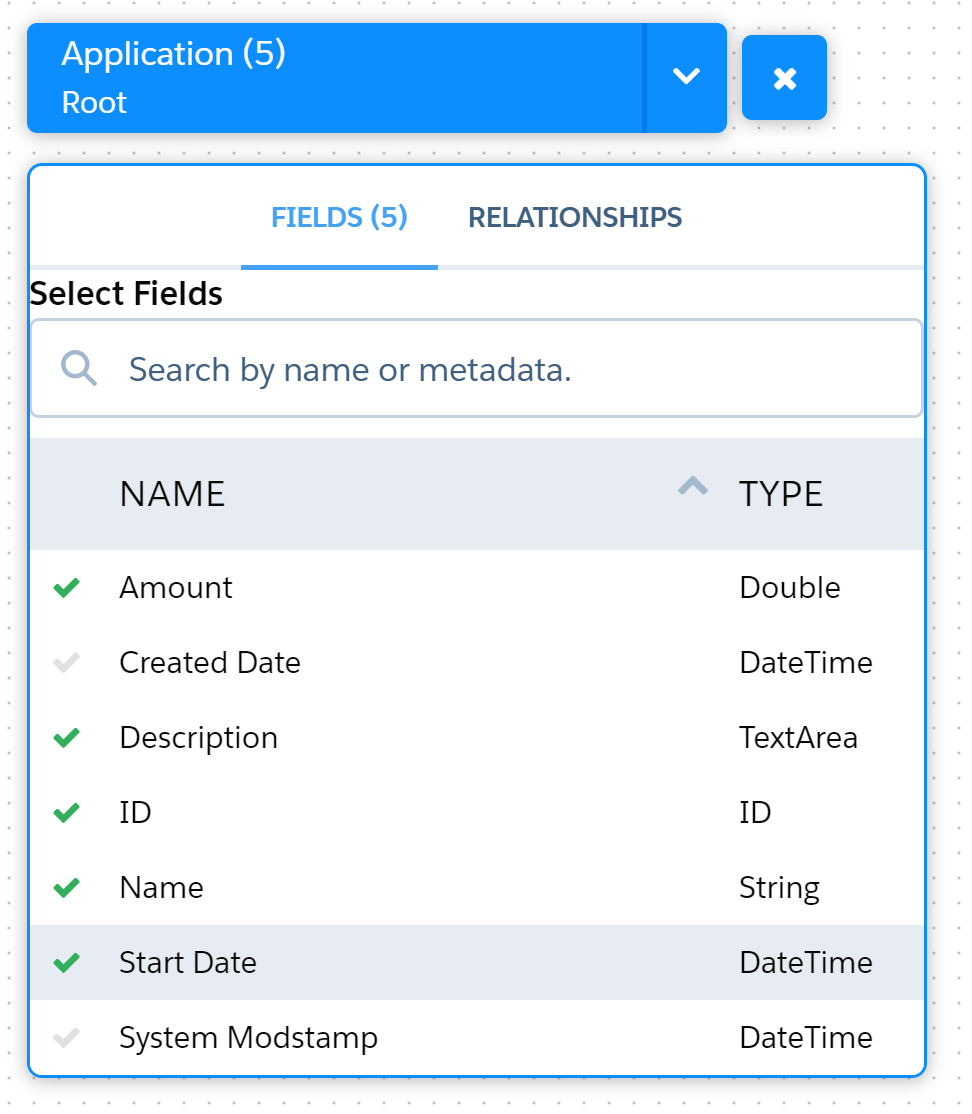
Choose related objects from Relationships tab.
From Account, I have selected Name, Type and Billing Country.
Big Object Dataflow will look like this:

After that data will be pulled to the dataset, we can also schedule for refreshing the data.
Lens

Create an App - Here App is created with a name Big Object App
Create an Dashboard under the App.
Let's say 2 components to be added into the Dashboard, here Chart and Table type has been added.
Design screen will be as follows and Donut chart is selected for display
Chart Lens

Table Lens

And final dashboard will comprise of both the components and if we run the dashboard, we will see the final outcome as above.
You can see, both the Chart and Table Type displays all the rows of Big Objects and showing related all the accounts (Abbott358 Inc and Acme).
Let's say, if want to expose this dashboard to the Account page and only show the related Application Big Object's record.
Display Einstein Analytics Dashboard on Record Detail Page
Open the Account record and click on Edit Page to open in Lightning App Builder.
Select Einstein Analytics Dashboard component and drop that on the page.
Now, put Dashboard Filter so that only related Application records for that Account to be displayed.

And, finally save and activate this page.
So, we have overcome the limitation of displaying Big Object's records in dashboards through Einstein Analytics.
Hi Sir,
ReplyDeleteI created account in wave analytics developer edition, but i did not find the Analytics Studio in Org. I have enable any settings related the analytics.
Thanks,
Sreenath
Salesforce training in Noida- Webtrackker technology is the best IT Company in Noida which is also providing the best salesforce training in Noida with live projects by the real time working experts. Webtrackker is also known as the best python training institute in Noida.
ReplyDeleteThanks for that Information, If you find more about Salesforce, you can click here: Salesforce training in Delhi
ReplyDelete